-
4 minutes
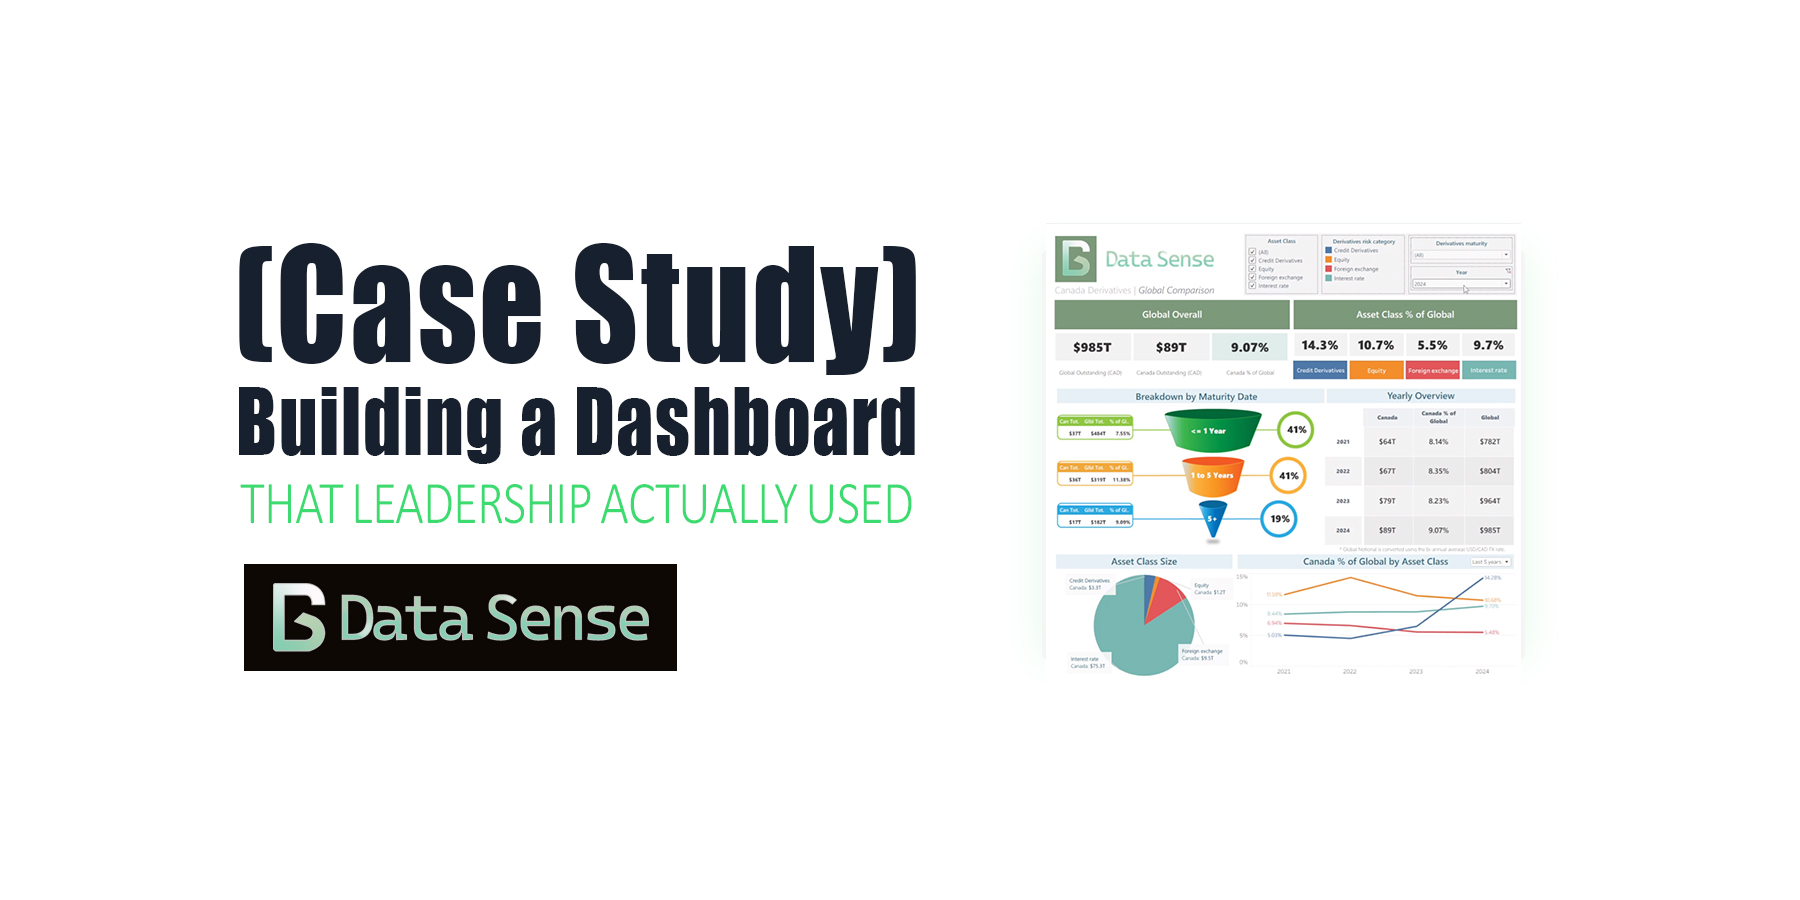
Building a Dashboard That Leadership Actually Used (Case Study)
Read More ->: Building a Dashboard That Leadership Actually Used (Case Study)A case study on a global derivatives dashboard. What started as a simple Tableau build ended up shaping future ETL automation, data scraping pipelines, and dashboards for years.
-
4 minutes
Top 5 Power BI Dashboard Tips to Improve Your Reports Today
Read More ->: Top 5 Power BI Dashboard Tips to Improve Your Reports TodayPower BI has helped democratize dashboards by giving anyone, from aspiring data analysts to business managers, the tools to explore, visualize, and share insights. Building a Power BI dashboard that looks good is easy, but building one that actually works takes intention. In our last article, we looked at why most Power BI dashboards fail and the five common mistakes behind them. This time, let’s fix them with five practical, easy-to-apply Power BI tips you can use today.
-
5 minutes
Why Most Power BI Dashboards Fail (5 Simple Fixes)
Read More ->: Why Most Power BI Dashboards Fail (5 Simple Fixes)Power BI has helped democratize dashboard creation by giving anyone, from sales aspiring data analysts to sales managers all the tools to build a great dashboard. Sadly, most of these dashboards end up in a folder somewhere, never getting the attention they deserve. Sometimes the issue is design; cluttered layouts, overuse of color, inconsistent filters. Other times, the data itself is messy, misaligned, or misunderstood. The result? Dashboards that look impressive but fail to inform. I’ve reviewed hundreds of Power BI dashboards being posted on LinkedIn, and the same five mistakes show up again and again. Here’s how to fix them in minutes…
-
8 minutes
Dashboard Design Best Practices: From Charts to Clarity
Read More ->: Dashboard Design Best Practices: From Charts to ClarityOver the past few years, dashboards have become ubiquitous. Thanks to the “democratization of data visualization tools,” everyone is suddenly an analyst. With drag-and-drop interfaces and endless templates, it’s never been easier to pull data into a dashboard and share it with colleagues or executives. The problem? Most dashboards are bad. They don’t follow dashboard design best practices. You’ve probably seen them shared on LinkedIn: messy color schemes, overcrowded with charts, crammed into tiny panels, or spread across dozens of pages. They look neat, but they don’t communicate. At best, they confuse. At worst, they actively mislead.
-
8 minutes
The Democratization of Data Visualization: Lessons from Plotly
Read More ->: The Democratization of Data Visualization: Lessons from PlotlyFor decades, data visualization was the guarded domain of BI specialists, statisticians, and data analysts. If an executive wanted a dashboard or a policymaker needed an analysis, they had to request it through a central analytics team and wait days or weeks for results. That world is gone. Today, thanks to platforms like Tableau, Power BI, and open-source frameworks such as Plotly Dash and Plotly Studio, almost anyone can spin up an interactive dashboard. This shift, known as the democratization of data visualization, promises faster insights, broader participation, and fewer bottlenecks from overworked data teams or gaps in expertise.
-
20 minutes
Financial Data Automation ROI: A Data Professional’s Guide
Read More ->: Financial Data Automation ROI: A Data Professional’s GuideThe financial services sector is experiencing a data automation revolution, with 82% of CFOs increasing investments in digital technology in 2024, yet 49% of finance departments still operate with zero automation, relying on manual data entry and Excel spreadsheets (Solvexia, 2025). For data professionals, demonstrating financial data automation ROI has become critical as organizations seek […]
-
11 minutes
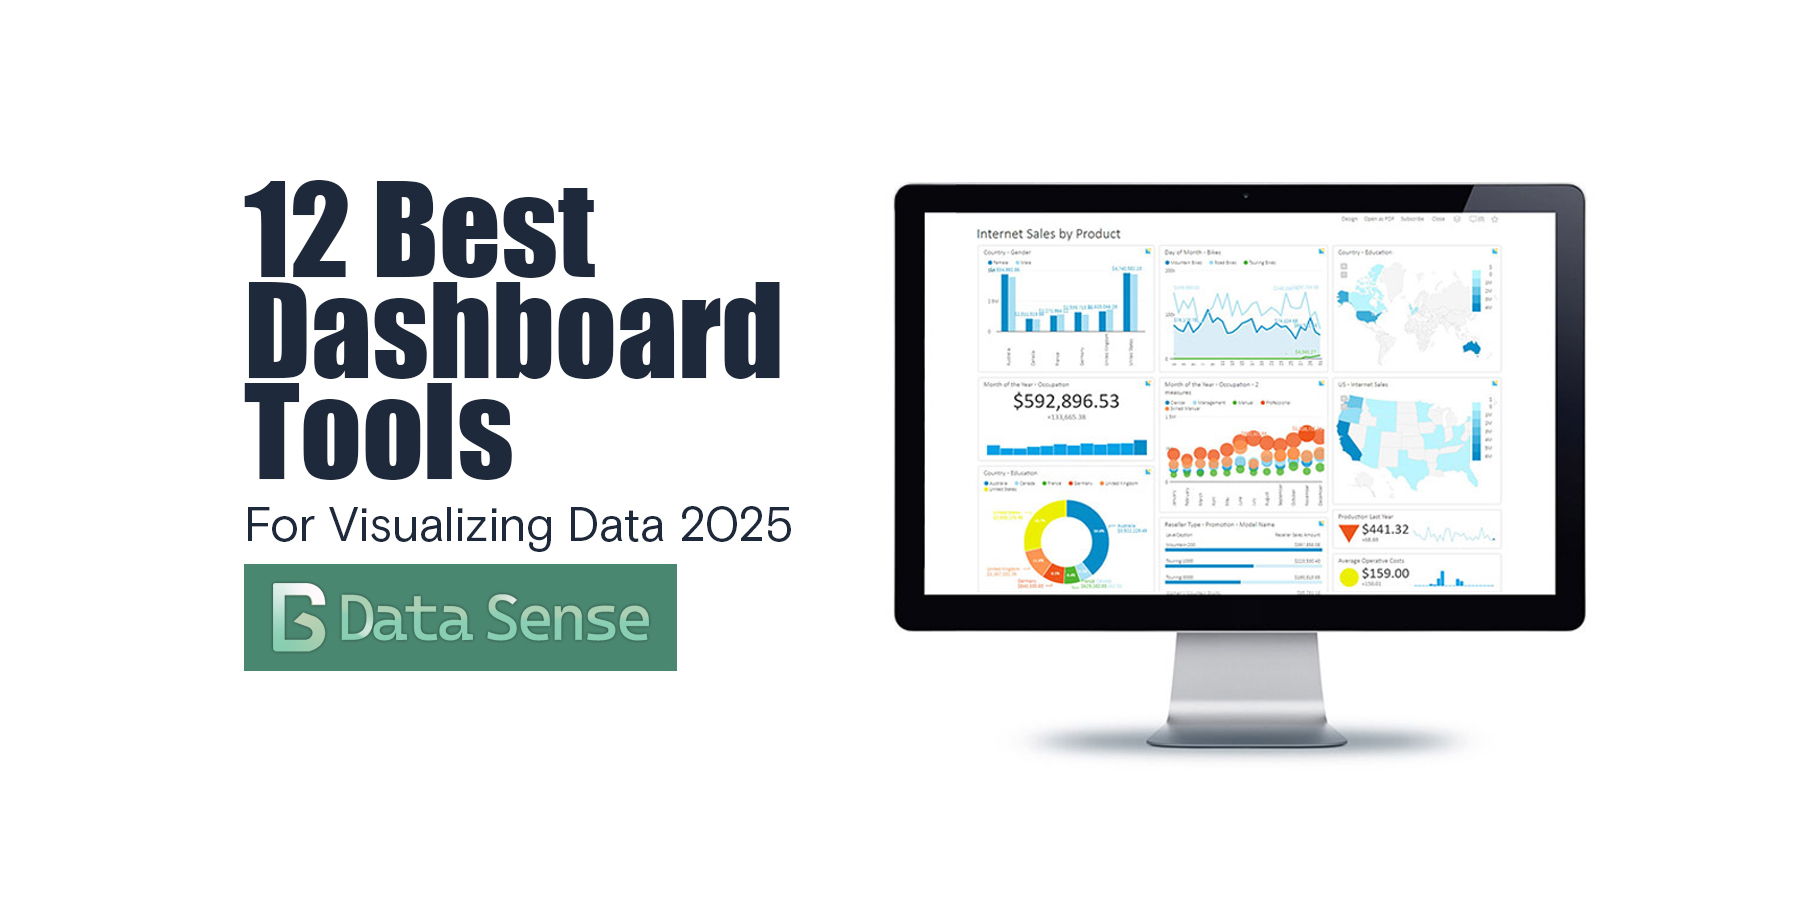
12 Amazing Dashboard Tools for 2025
Read More ->: 12 Amazing Dashboard Tools for 2025The data landscape in 2025 is more dynamic and demanding than ever before. The data landscape in 2025 is more dynamic and demanding than ever before. Businesses are drowning in data but starving for insights. Manual data wrangling, complex setups, and the perpetual need for specialized data teams often trap great ideas and stifle agility. […]
-
9 minutes
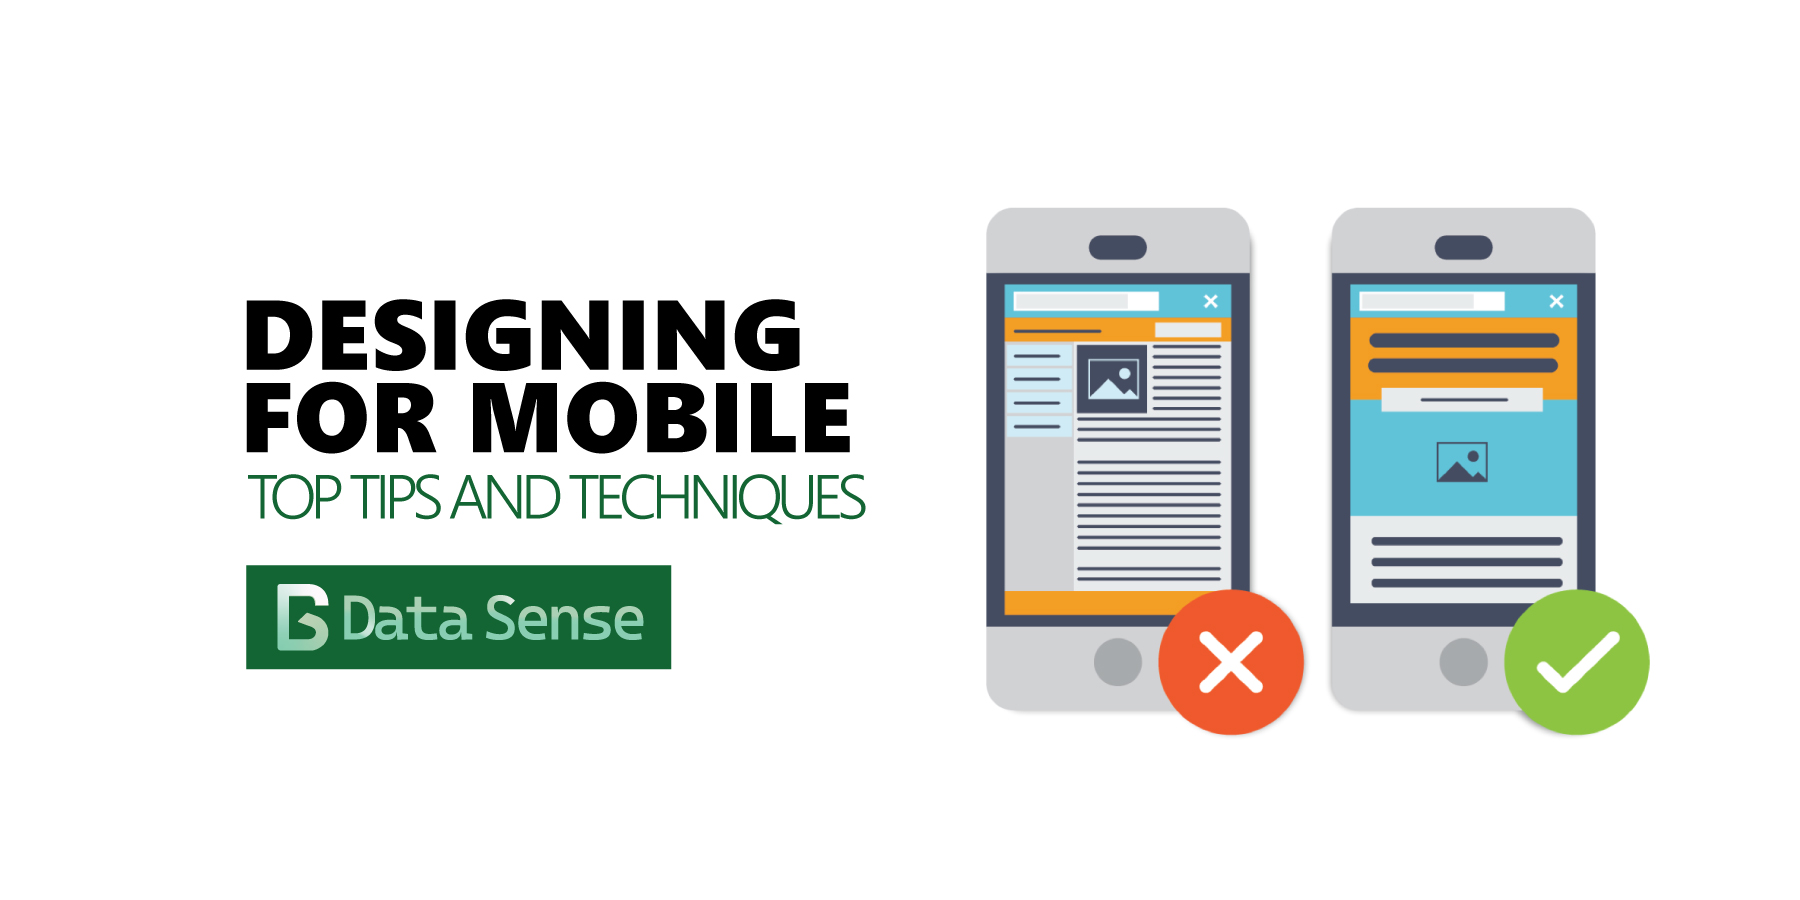
Best Practices for Adapting Data Visualization for the Mobile Devices
Read More ->: Best Practices for Adapting Data Visualization for the Mobile DevicesIn an era defined by rapid digital transformation, our interaction with data is undergoing a remarkable shift. As smartphones continue to dominate how we access information, the demand for data visualizations that captivate and inform on smaller screens is at an all-time high. This evolution is not just about aesthetics, it’s about making valuable insights […]
BROWSE PAST POSTS
Blog Archives
Explore our entire collection of articles, organized by publication date.
Posts from
Data Visualization
View Year:
©2025 Data Sense. All rights reserved.
