Introduction
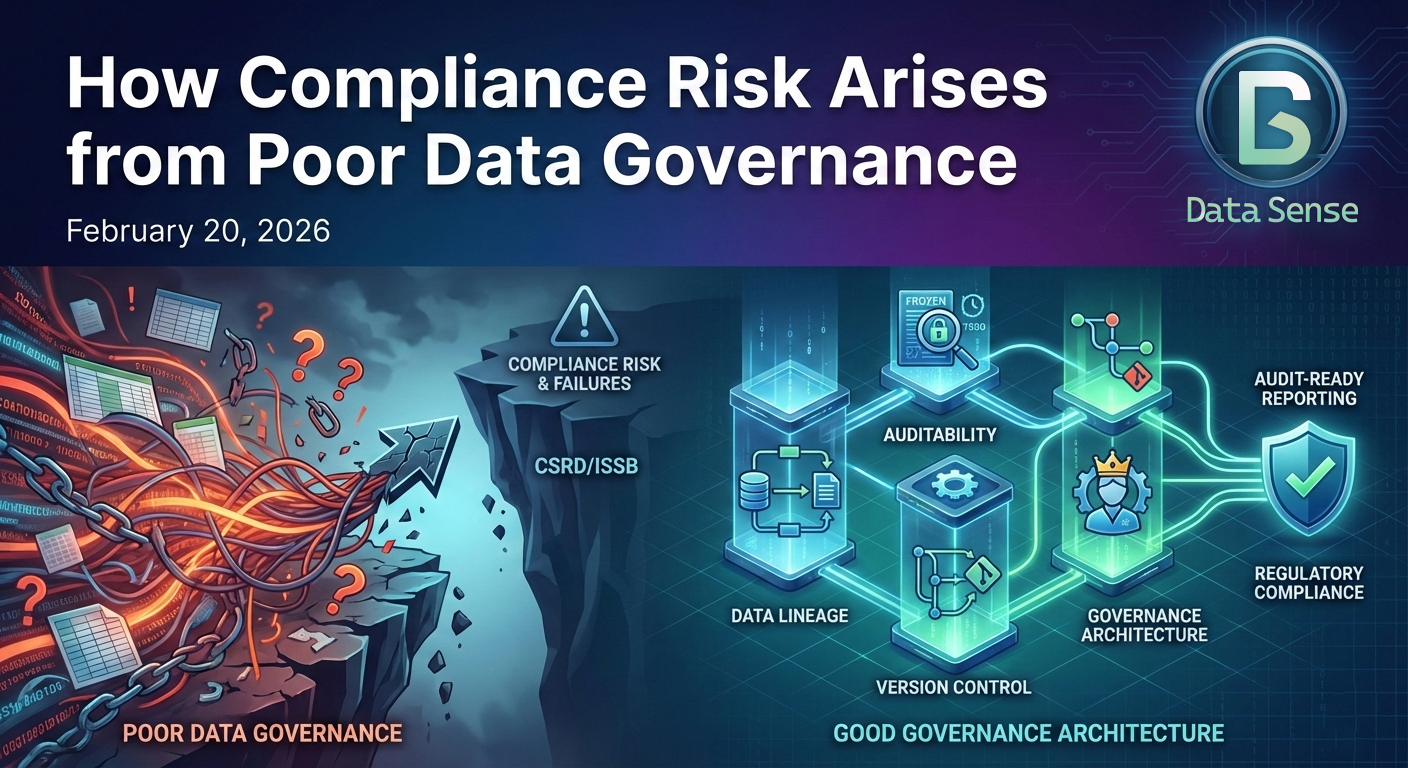
Most compliance failures don’t begin with fraud. They begin with poor data governance — inconsistently defined metrics, unclear ownership, scattered calculations, undocumented methodology.
Under the Corporate Sustainability Reporting Directive (CSRD), climate and sustainability disclosures are subject to structured reporting standards issued by European Financial Reporting Advisory Group (EFRAG) and increasingly aligned with International Sustainability Standards Board (ISSB) standards.
These frameworks require:
- Transparent methodologies
- Consistent definitions
- Boundary clarity
- Period-to-period comparability
- Audit-ready documentation
This turns sustainability metrics into regulated control objects.
If your definitions are vague, unversioned, or spreadsheet-dependent, you do not have a reporting problem.
You have a governance architecture problem.
Four Elements of Good Data Governance
1. Data Lineage
Definition:
Data lineage is the documented, end-to-end traceability of a metric from its original source through every transformation, calculation, and aggregation step to its final reported value.
It answers:
- Where did this number originate?
- What systems did it pass through?
- What logic was applied?
- Which assumptions and factors were used?
In regulated reporting, lineage ensures a metric can be independently reconstructed from controlled source data and documented methodology.
2. Auditability
Definition:
Auditability is the ability to reproduce a reported metric exactly as disclosed, using the same data, methodology, and configuration that were in place at the time of reporting.
It answers:
- Can we re-run last year’s report and get the same number?
- Can we prove which inputs and assumptions were used?
- Can an independent reviewer validate the result?
Auditability requires frozen reporting snapshots, documented methodologies, and controlled calculation environments.
3. Version Control
Definition:
Version control is the formal tracking and documentation of changes to metric definitions, boundaries, assumptions, and calculation logic over time.
It answers:
- What changed?
- When did it change?
- Who approved the change?
- Why was it changed?
- Does it affect prior disclosures?
Without version control, comparability breaks and regulatory risk increases.
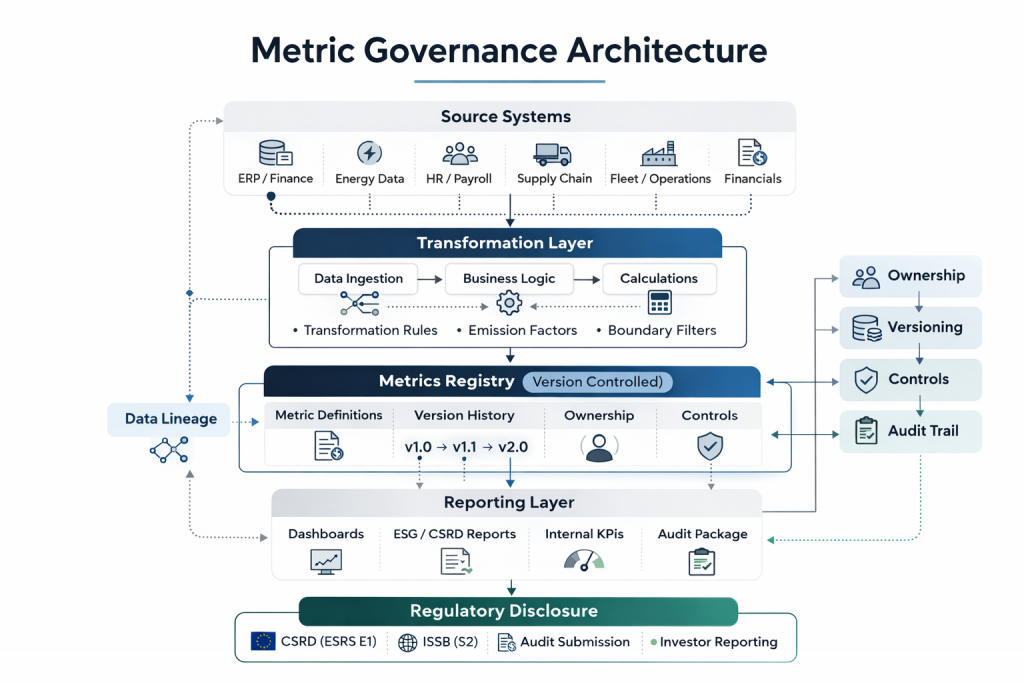
4. Governance Architecture
Definition:
Governance architecture is the structural framework that assigns ownership, embeds controls, and formalizes workflows around regulated metrics.
It answers:
- Who owns this metric?
- Who maintains the data pipeline?
- What approval process governs changes?
- Which regulatory requirement does it map to?
- What internal controls support it?
Governance architecture transforms metrics from informal calculations into controlled, accountable reporting assets.
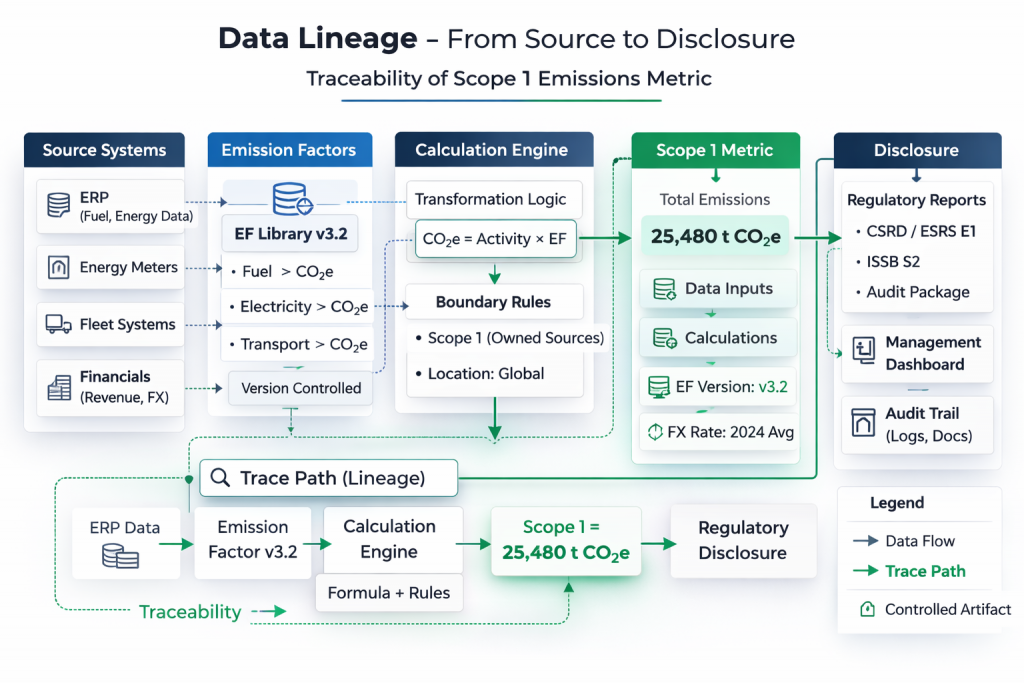
1. Data Lineage: Can You Trace the Number?
Compliance Risk:
Loose definitions of “Scope 1 emissions” can lead to different interpretations across teams.
Auditors cannot independently reconstruct the number from documented methodology and controlled source data.
Under CSRD and ESRS E1 (Climate Change), companies must disclose methodology, assumptions, and organizational boundaries.
Tactical Implementation
For each climate KPI:
- Map source systems (ERP, energy meters, fleet logs, financial systems)
- Document transformation logic (activity data × emission factor, boundary exclusions)
- Record emission factor versions and data vintages
- Store calculation logic in controlled environments (not ad hoc Excel)
Lineage should show:
- Organizational boundary (subsidiaries vs JVs vs equity-method entities)
- Operational boundary (which Scope 3 categories are included)
- Emission factor source and version
If you cannot trace a reported tonne of CO₂e back to a source dataset and factor version, the metric is not audit-defensible.
2. Auditability: Can You Reproduce Last Year’s Report?
Compliance Risk
Comparability breaks when metrics such as “carbon intensity per revenue” are calculated differently across analysts or reporting cycles.
Under CSRD and ISSB S2, companies must disclose:
- Changes in methodology
- Restatements
- Comparability explanations
Tactical Implementation
Treat sustainability metrics like financial KPIs:
- Freeze metric definitions at reporting cut-offs
- Store reporting-run snapshots (dataset versions, FX tables, emission factor library)
- Log configuration parameters for each report generation
- Maintain intermediate outputs (facility-level emissions, category-level Scope 3)
If an auditor asks:
“Re-run the 2024 report using the 2024 methodology.”
You should be able to produce the same number.
Without manual reconstruction.
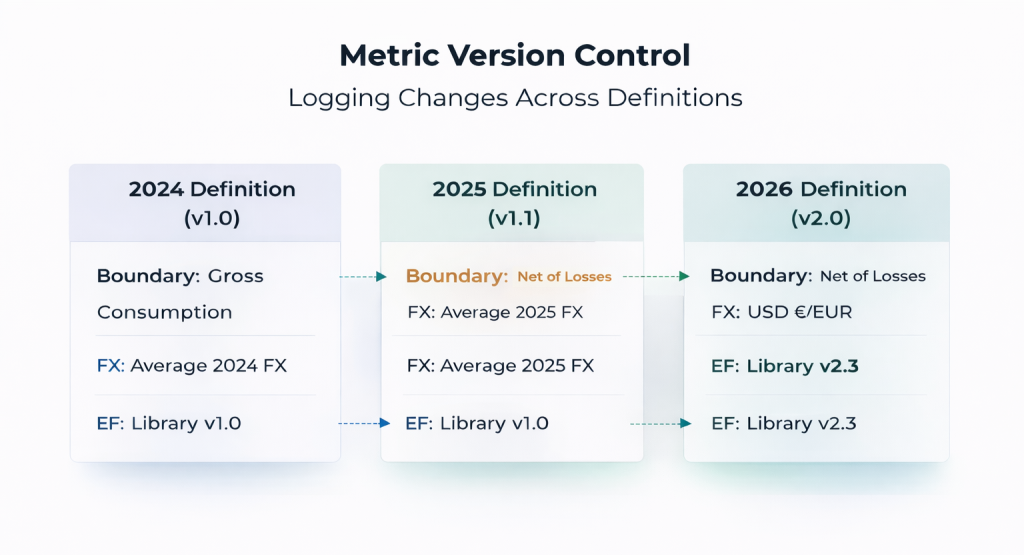
3. Version Control: What Changed and Why?
Compliance Risk
Without proper documentation, comparing metrics when there are changes to the measurement becomes impossible.
For instance if your renewable electricity % shifts from “gross consumption” to “net of losses” without documentation, comparability is broken.
Under CSRD and ISSB S2, changes in calculation methodology must be disclosed and explained.
Tactical Implementation
Version-control:
- Metric definitions (not just code)
- Boundary rules
- Emission-factor libraries
- Allocation keys
- Revenue bases
Each version should log:
- Who approved the change
- Why it changed
- Which reports are affected
- Whether prior periods require restatement
Metrics should live in a controlled registry, not in slide decks, spreadsheets, or Power BI dashboards.
Automating Governance Controls
Manual governance does not scale.
Modern data platforms allow:
- Version-controlled metric registries
- Automated lineage mapping
- Change-impact analysis before metric updates
- Controlled semantic layers
See our case study:
🔗 Automating a Risk Control Dashboard with AI
4. Governance Architecture: Who Owns the Metric?
Compliance Risk
When there is no clear ownership of the metric, or a central definition, anyone can change the formula.
“Scope 1 per revenue” can become inconsistently defined and lead to different results and interpretations.
That creates inconsistent disclosures across:
- Internal dashboards
- Investor presentations
- Regulatory filings
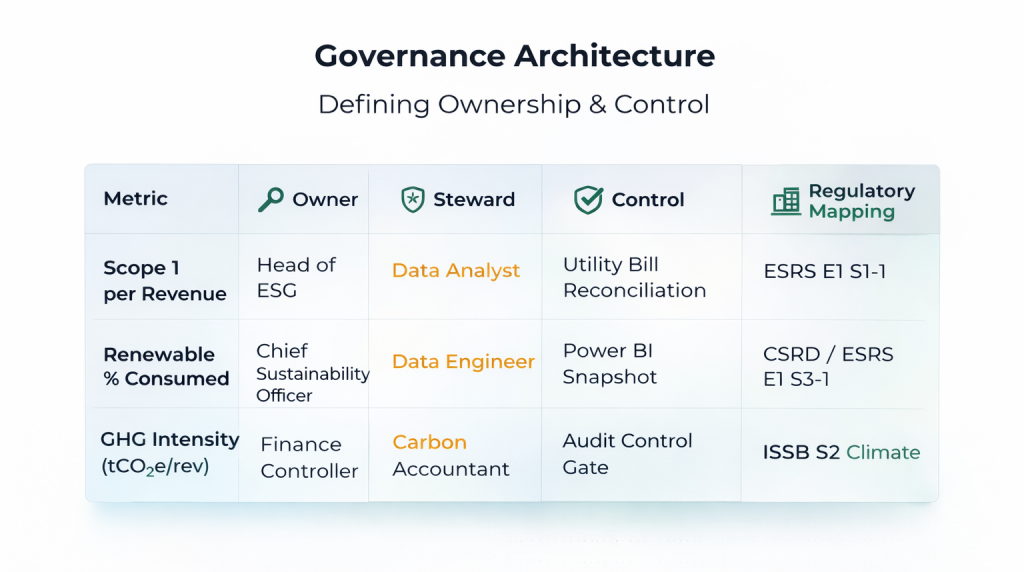
Tactical Implementation
For each regulated metric:
- Assign a metric owner (regulatory responsibility)
- Assign a data steward (pipeline integrity responsibility)
- Map the metric to:
- Specific CSRD / ESRS requirement
- Internal control (e.g., quarterly reconciliation to utility bills)
- Review workflow
In medium to large organizations the ownership can be governed by a central data authority, not IT.
Metrics should be embedded in governance workflows:
- Change approval gates
- Documentation requirements
- Impact analysis before modification
This is not sustainability consulting.
It is regulated data control.
Example: Scope 1 Emissions per Revenue
Weak definition:
“Scope 1 emissions divided by revenue.”
Control-grade definition:
- Scope 1: Direct emissions from owned or controlled sources per 2025 CSRD-aligned methodology
- Boundary: Same organizational perimeter as audited financials
- Revenue: Group revenue in USD using average annual FX from audited statements
- Emission factors: Library version X.Y, frozen at reporting cut-off
- Calculation stored in version-controlled metrics registry
Now you can:
- Trace inputs (lineage)
- Reproduce historical values (auditability)
- Document definition changes (version control)
- Demonstrate ownership and controls (governance architecture)
Conclusion
Climate reporting is not a dashboard problem.
It is a metric-governance problem.
As sustainability disclosures become regulated, metrics must move from spreadsheets to controlled semantic layers with:
- Versioned definitions
- Documented lineage
- Embedded controls
- Reproducible pipelines
Weak definitions create compliance risk.
Strong architecture reduces it.